Lyft IPO valuation: a US$20bn rideshare


Every IPO has a story, especially in the consumer technology sector. This one is a tale about bad and good, black and pink, uber vs lyft. Unlike many other markets, the ride-sharing market due to original huge fragmentation and regulation was significantly underlooked. Since 2010 when Uber and then Lyft, Via, Juno, Gett emerged over US$10bn of venture capital alone (+ at least double of that coming directly from P&L of companies) was deployed into the market. This swiftness of capital allocation coupled with strong network effects of the business model created huge barriers to entry for new players leaving the market in oligopoly stance.
Investment highlights
- Vibrant market: swiftly growing company with 2018 growth at 100% and 2019 expected revenue growth at 52%.
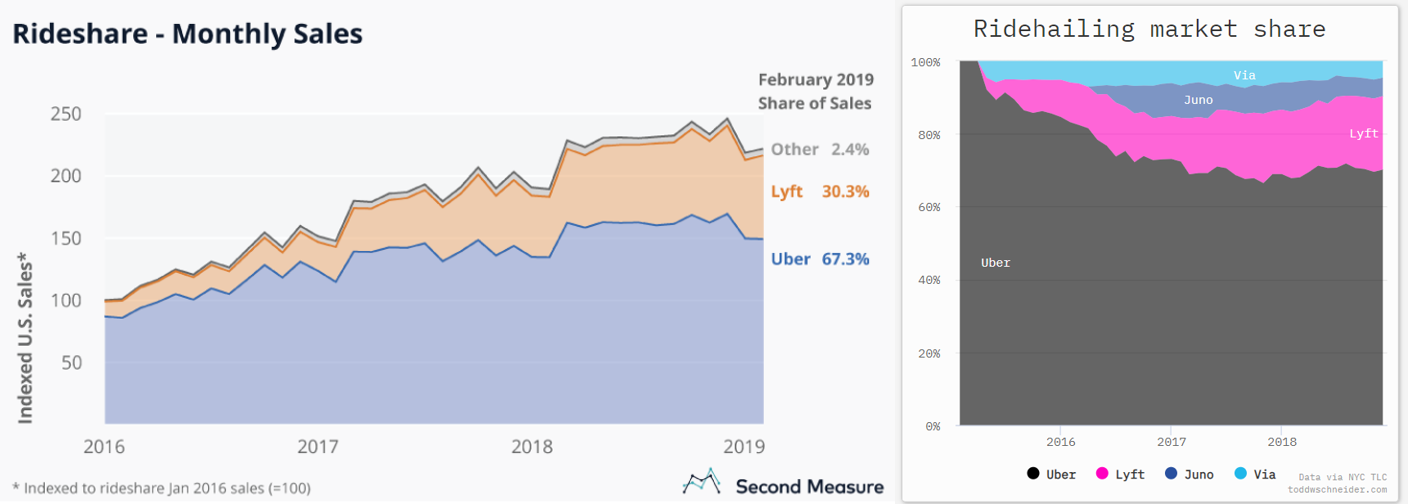
- Growing market share: with strong oligopoly position (in 2 year market share grew from 13% to 30% by Feb 2019)
- Strong retention: 150% net dollar retention with 5Y LTV / CAC above 2.5x
- Healthy IPO price upside relative to the Lyft intrinsic value
- Strong momentum due to the absence of digital automotive stocks
Key risks:
- Increasing commission margin: One of the key risks for Lyft is its ability to further increase commission margin in case of stronger competition. Should the commission margin stay at the current level of 27%, target EBIT margin potential will decrease from 30+% levels down to low 20s and has a significant impact on company intrinsic value.
- Generating non-reimbursed demand: Another key risk is the ability to generate demand from consumers that not reimbursed by corporates. We have seen some success in outer boroughs of NYC, yet the question remains to achieve that on a nationwide scale
- Government scrutiny: Increasing scrutiny from local government is another risk, however, the company already built ca. US$800mln war chest to defend itself.
- Autonomous demand: Ability to integrate autonomous vehicle providers into its modality platform to compete with car manufacturers.
- Independent contractors: For now, Lyft drivers are independent contractors, not employees. But that could change, which will put significant pressure on gross margin.
——————————————————————
DOWNLOAD LYFT IPO VALUATION (HERE)
——————————————————————
Let's look at different data points in the following structure to understand if Lyft's IPO offers any upside above its current IPO valuation.
- Market opportunity
1.1. Definining addressable market
1.2. Historical and growth drivers
1.3. Competition
1.4. Forecasting Lyft revenue - Business model
2.1. Understanding business model
2.2. Network effects
2.3. Unit-economics - Financial
- Lyft IPO Valuation
So, what makes Lyft a potentially good investment story? Let's start with the basics.
1. Market opportunity
1.1 Defining addressable market.
Оriginal market entry for ride-sharing was the traditional taxi market by offering order simplicity, however, since then it already outgrew it and moving into consumer budget for transportation.
USA taxi and limo market is not the largest cab market in the world, but quite significant with ca. US$26bn of GMV spent annually. Taking 25% commission margin (Lyft's average margin for 2018 was 26.5%), it provides a US$6.25bn revenue pool for ride-hailing companies.
However, let us check to see if such an approach fully captures the total addressable market size for ride-sharing companies.
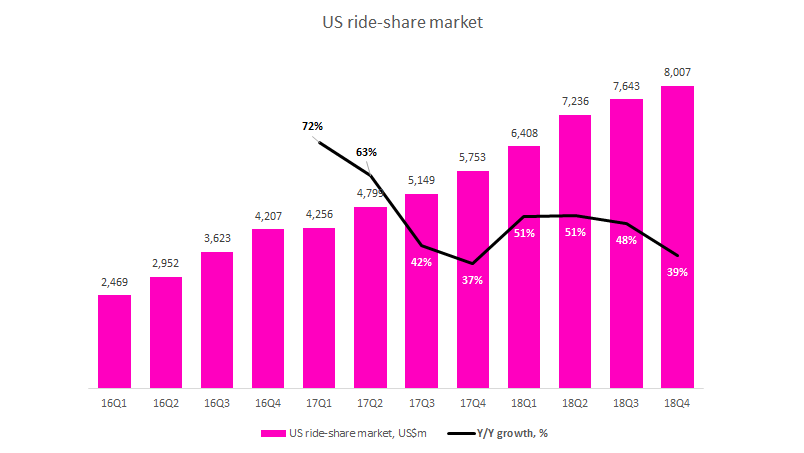
Lyft 2018 revenue was US$2.2bn and its share stands at 27% for 2018 (by third-party estimates), which means sharing companies already generated ~US$7.3bn revenue pool in 2018 or ca. US$30bn GMV. That would imply that ride-sharing companies already ate over 100% of the taxicab market, but how is it still growing at 40%. Does that mean there is no real upside?
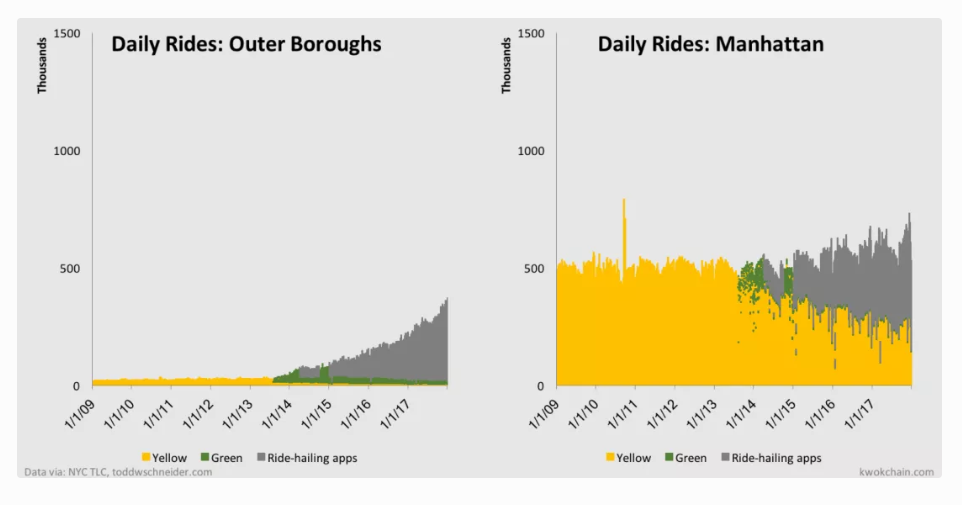
Looking at the NYC statistics, however, we see that in NYC area ride-sharing companies indeed churned half of the traditional taxi-cab business, specifically in Manhattan, yet also generated a whole new revenue stream where taxi businesses were poorly present.
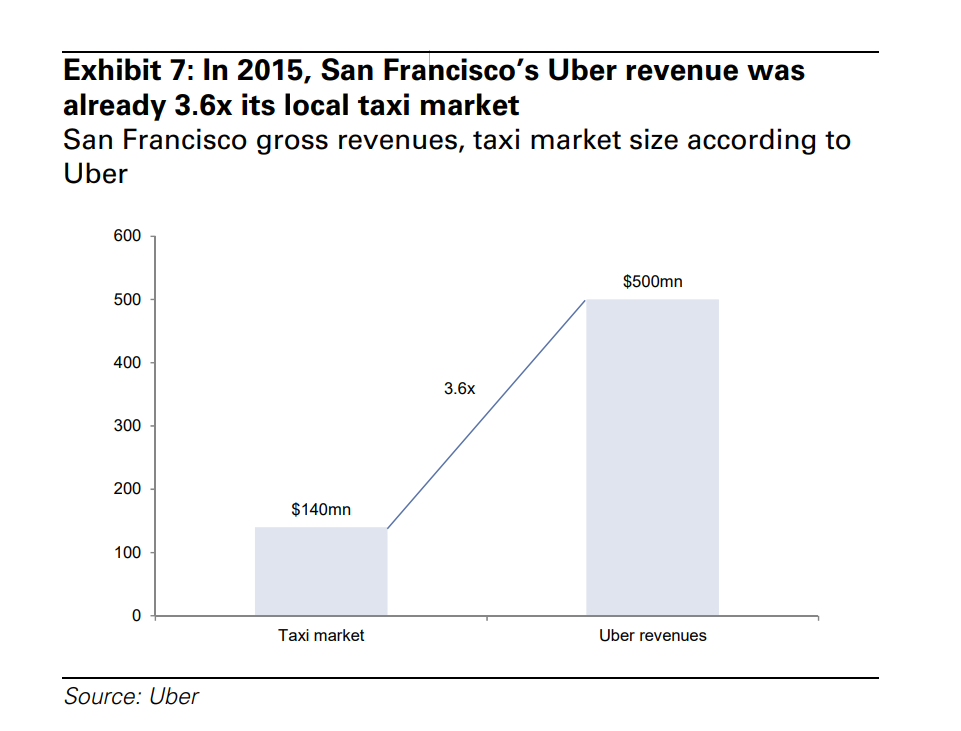
For instance, in San Francisco, HQ of Uber and Lyft, we can see that more of the same, Uber significantly expanding its TAM, outgrew the taxicab market by 5x.
Two questions arise from that:
- Why did that happen?
- How much is there growth potential?
1.2 Historical drivers and growth potential
A) Consolidating corporate T&E expenses
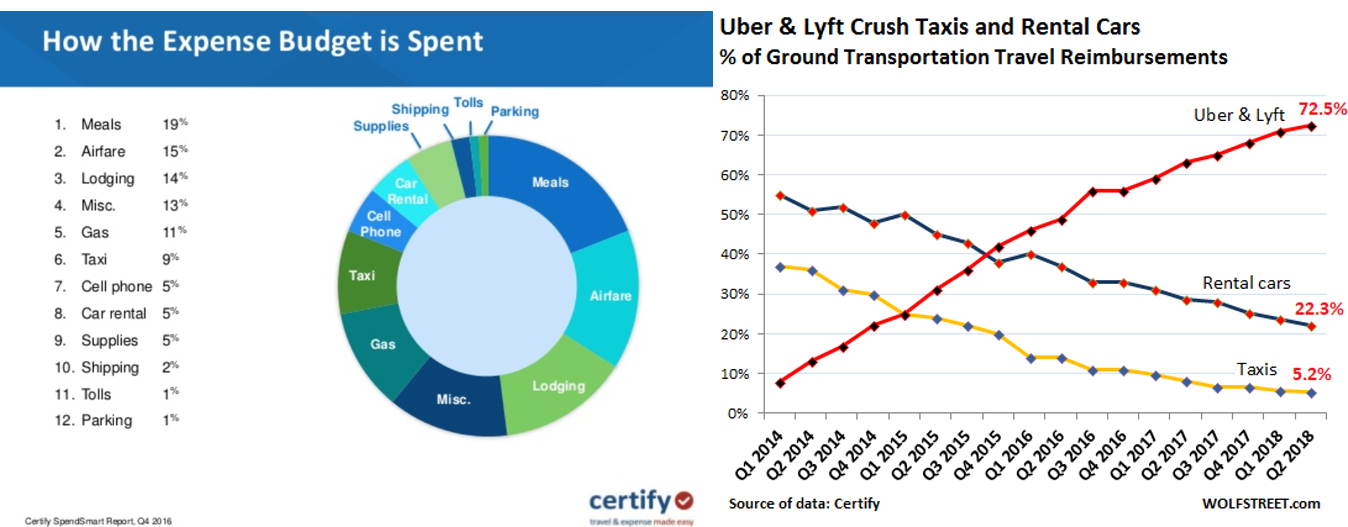
USA Corporate spent on travel & entertainment (T&E) on ground transportation & car rental is ca. 14% (9% is taxis & 5% is car rentals), with annual US spent at US$300bn, bring it to US$42bn. With the mass adoption of Uber and Lyft, the share of corporate reimbursements for Lyft & Uber grew to 70%, or U$28bn out of US$30bn ride-sharing market (which consists of business & consumer demand)
Corporates are no longer a growth driver. My estimate is that real consumer demand without business reimbursements is currently at ca. 10-20% of the US ride-share market or US$3-6bn in GMV per annum, with Lyft's share in non-reimbursed consumer bookings at US$1-2b or 12-25% of its total demand.
B) Mobility as a service: a shift from owning a car to utilizing a car
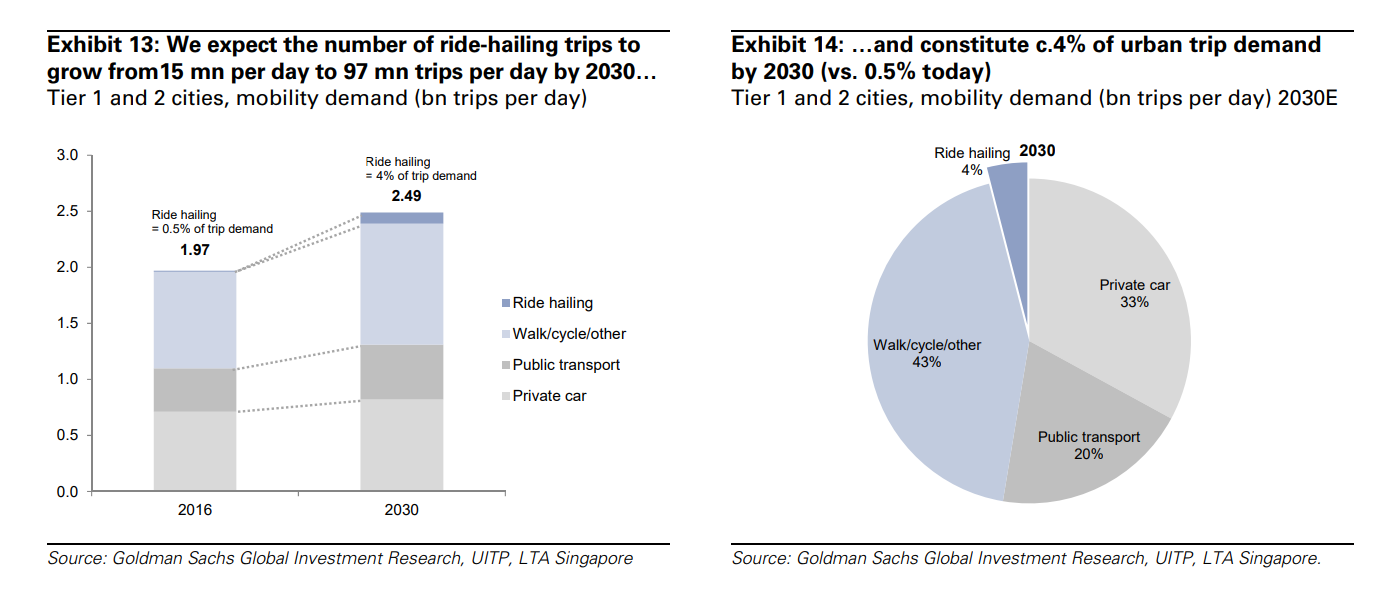
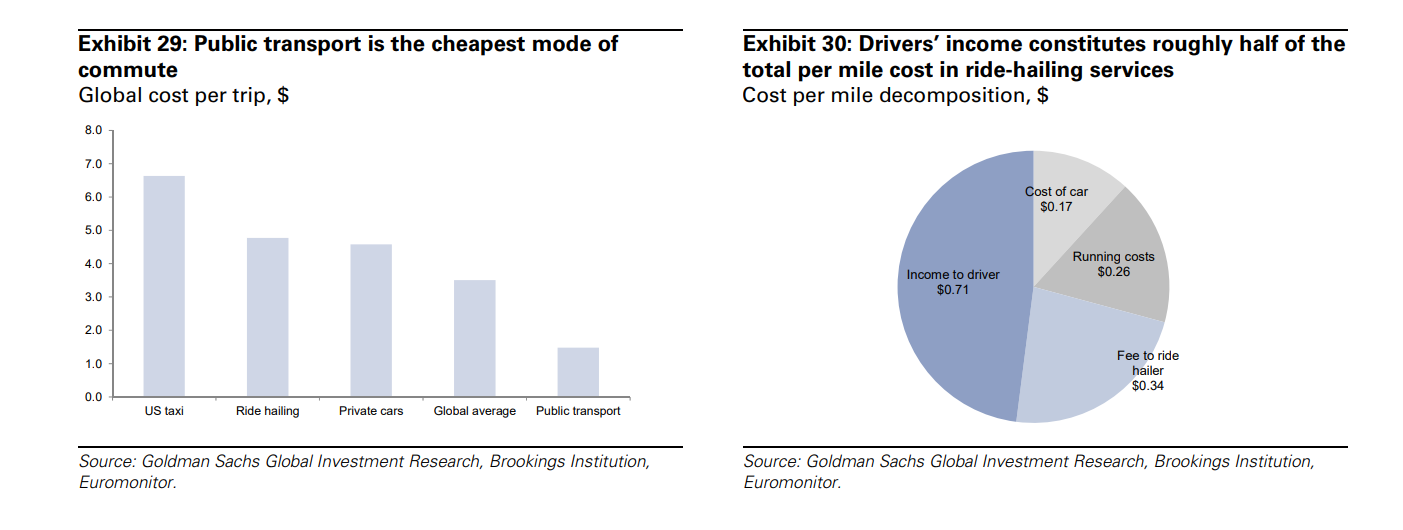
A year ago, private cars accounted for around 36% of the urban mobility demand, by Goldman Sachs (GS) estimates represents around 0.5% of the trip demand (15mn per day). Based on the doubling of the ridesharing market, today it represents around 1% of all trips.
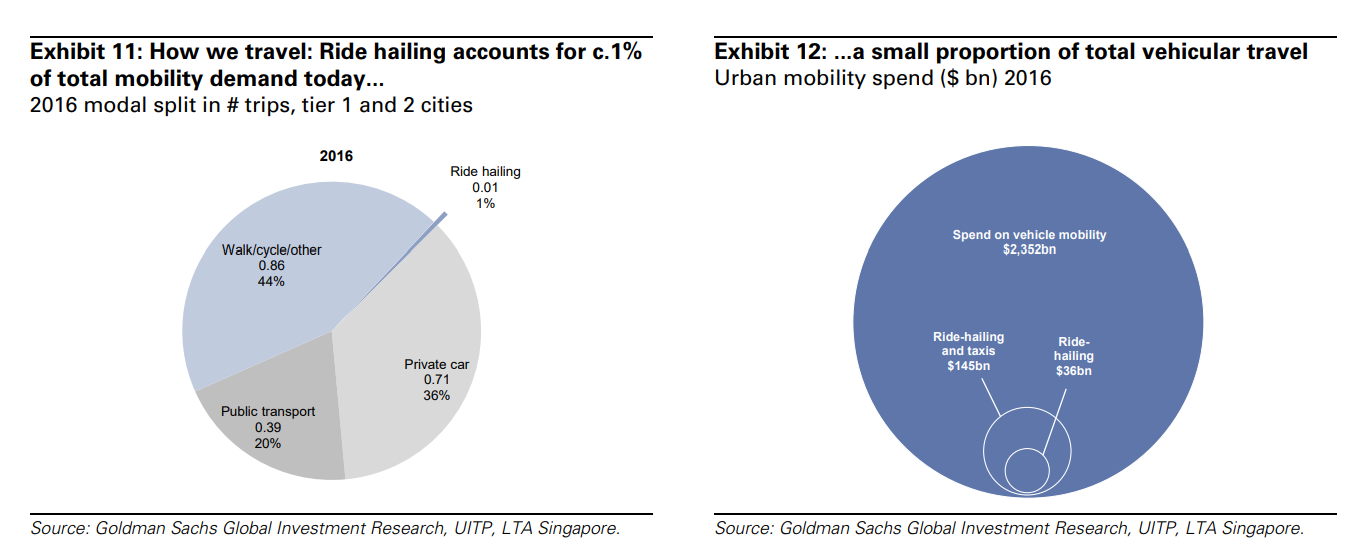
By 2030, GS estimates it will grow close ca. 100mn trips daily globally or 4%.
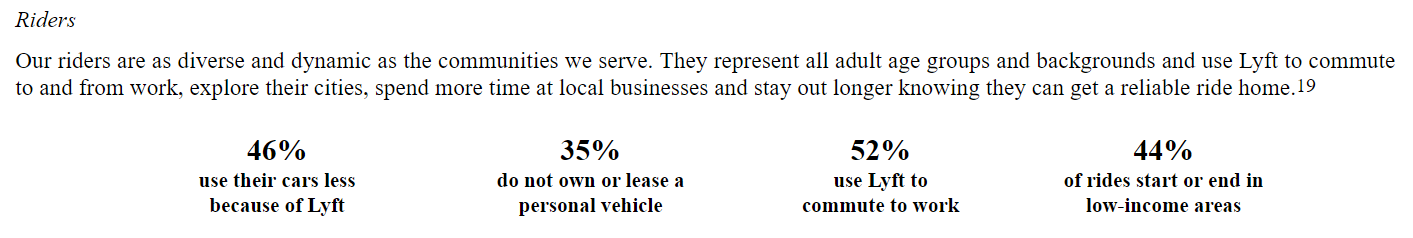
Firstly, this will happen due to consumers allocating more budget toward rideshare from current spent of $60-125 /annum (or 12-25% consumer demand * $500 Lyft's annual spent per active rider) which represents ca. 1.5-3% of household budget spent on car according to US Census (average US person spends ca. US$4k on car per year). This represents a huge growth driver, with an ability to reach ca. 10% of consumer budget spent in the majority of high dense cities, considering cost per mile for ridesharing companies is not much higher than owning a vehicle. This is also consistent with own Lyft statements:
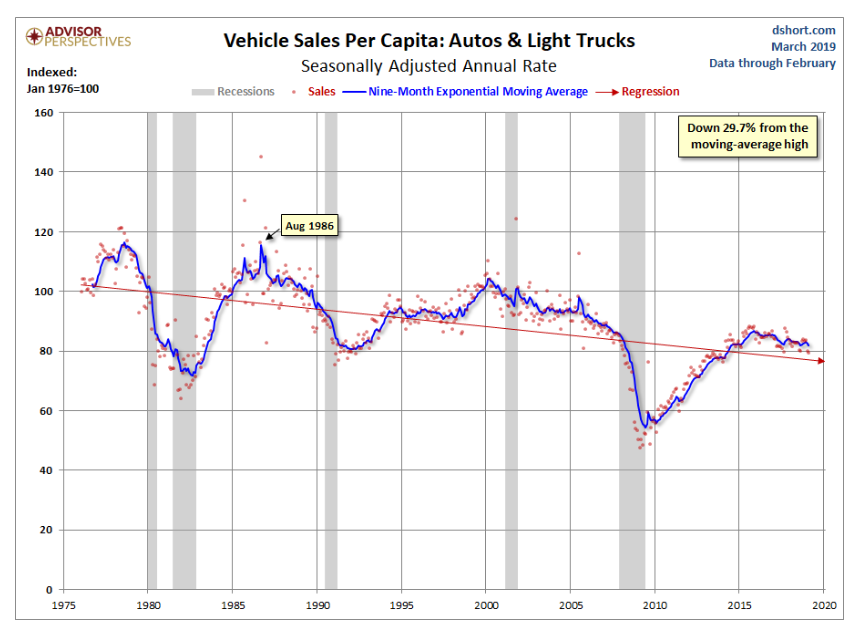
Secondly, we can also see a long-term trend of declining car ownership per capita.
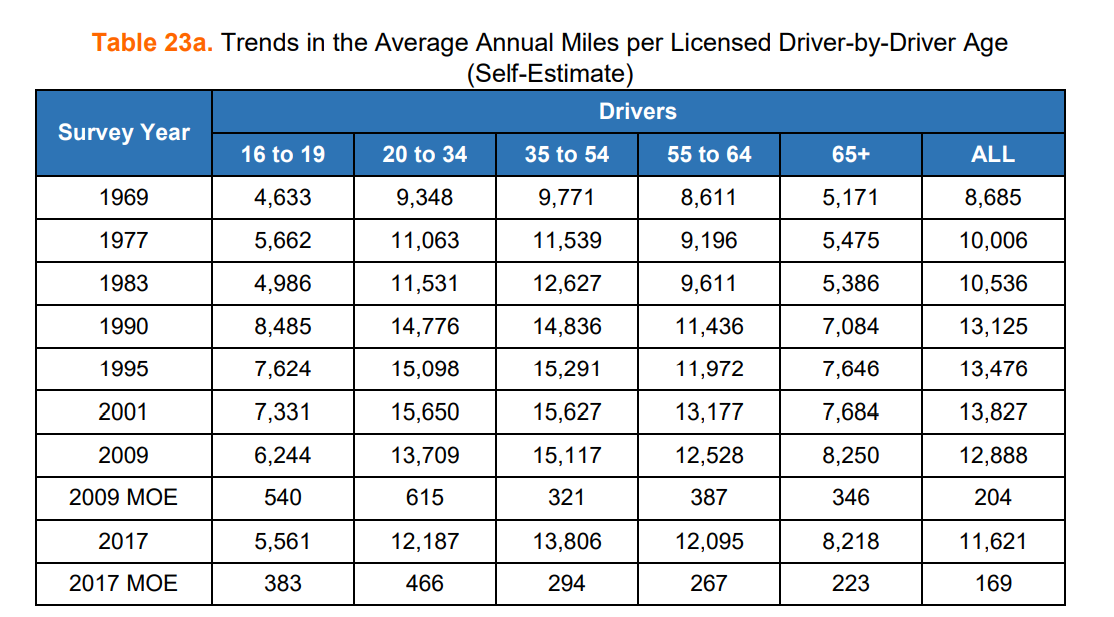
As a result of that and other We can also see, that average miles per licensed driver started declining across all groups during the last 3 decades:
- for the age group 16-19: -35% from peeking in 1990
- for the age group 20-34: -22% from peeking in 2001
- for the age group 35-54: -12% from peeking in 2001
- for the age group 54-64: -4% from peeking in 2009
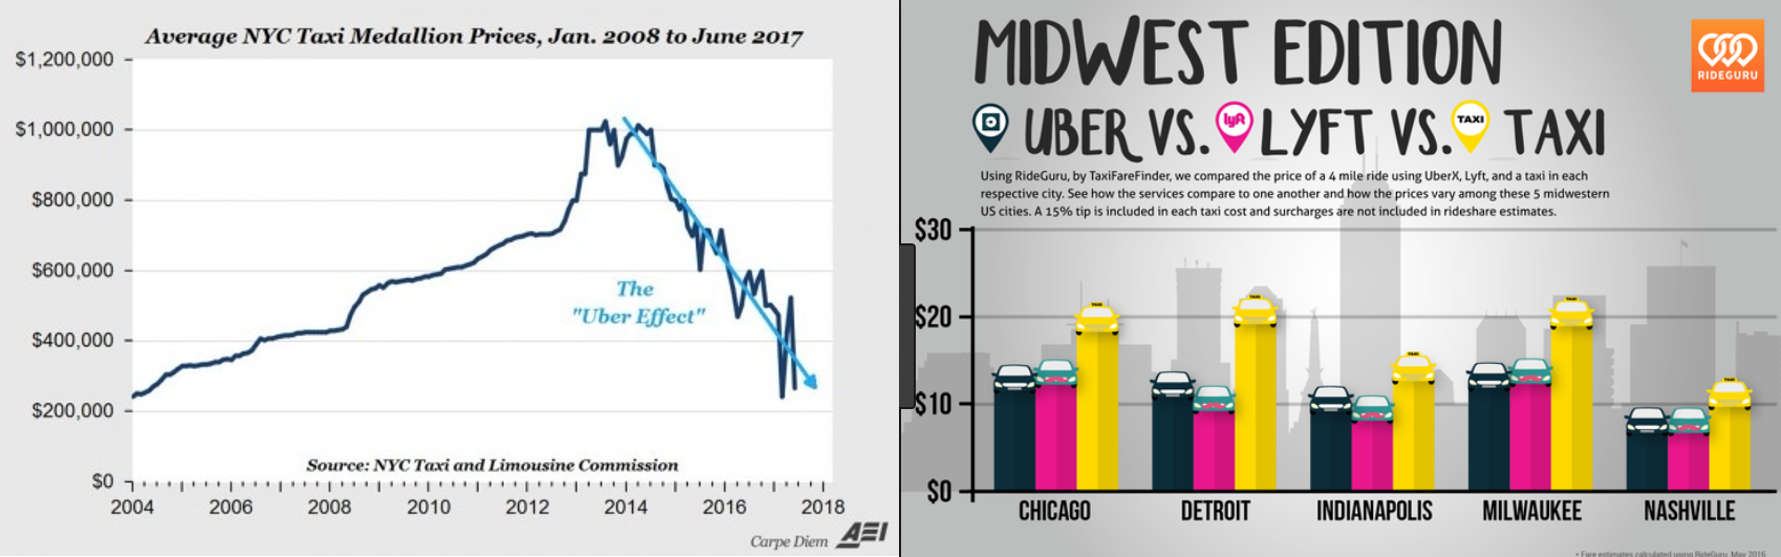
C) Further cannibalization of the offline taxi market
We can see that the taxi market cannibalized significantly and believe is to continue further with over 80% of it belonging to the ride-hailing companies. Medallion's price in many cities plummeted to decade lows. In NYC already hundred's of Medallion owners are filing for bankruptcies as they are unable to repay the loans taxi-drivers to fund the Medallion license.
D) Autonomous
One of the key things that ride-hailing companies brought to the mobility market is a new supply of cars previously unavailable due to high capital costs coupled with instant demand to fulfill high car utilization rate similar to taxi companies.
This provided better consumer rates than typical taxi companies which have overhead and Medallion capital costs in the majority of cities.
I believe the most impact from autonomous cars will come mostly from providing even more supply to the ride-hailing market. Impact on the business model we will cover later.
1.3 Competition.
A) Lyft market share
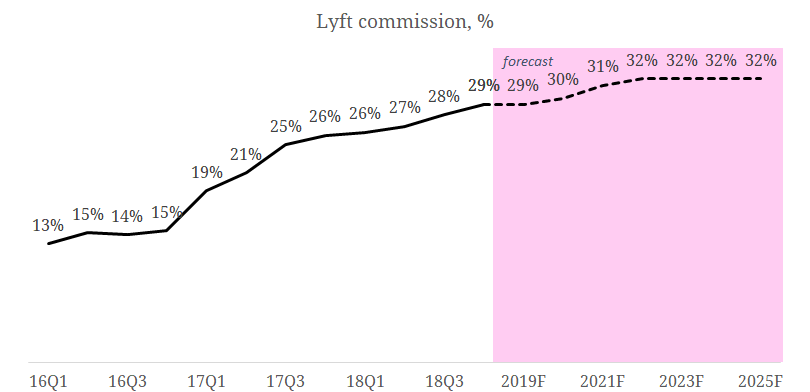
Lyft's share from 2016 to 2018 more than double growing from 13% in 2016Q1 to over 30% in 2019Q1. In NYC, most competitive cities of all, it's only grew from under 10% to over 20% by 2018.
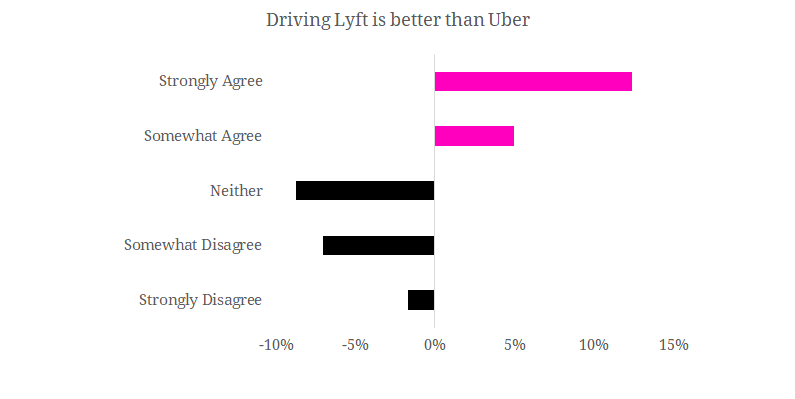
There were several reasons Lyft was gaining market share in recent years:
- Much stronger community ties. Over 700k from 30m riders participated in the roundup & donate.
- Stronger social responsibility. In 2016 and 2017 Uber's image was significantly hit by CEO actions, the company was hacked while also fueled by negative corporate culture news.
- Uber's key focus on international expansion
- Stronger driver satisfaction especially across Lyft Line vs UberPool
ca. 90% of millennials expect companies to produce and communicate the results of corporate responsibility and are likely to switch brands to one that is associated with a good cause, given similar price and quality. source: Lyft IPO prospectus
B) Other potential entrants:
Majority of car manufactures recognized that ride-sharing and autonomous driving is not too distant future and either partnering or plan to enter the market:
- BMW is gearing up iNEXT to be level 5 autonomous by 2021
- Daimler is partnering with BMW and Bosch
- Ford was experimenting with Chariot but recently shut it down.
- GM is partnering with Lyft among key partners, previously invested US$500m
- Tesla is pushing on with self-driving to deploy in 2019
- Toyota is rolling out its Mobility Services Platform (MSPF) to enable greater operational and rental and invests in Uber
- Volkswagen MOIA unit playing on various fronts, with significant investment intro Gett
- Gett: Euro-centric, with VW as a partner
- Avis is experimenting with Zipcar
- Hertz partnering with the ride hailers
- Alphabet Waymo seeks to monetize autonomous tech
1.4 Lyft revenue potential
Lyft's top line is a function of 4 parameters:
- # of active riders
- # rides per active rider
- average cost per ride
- Commission Margin

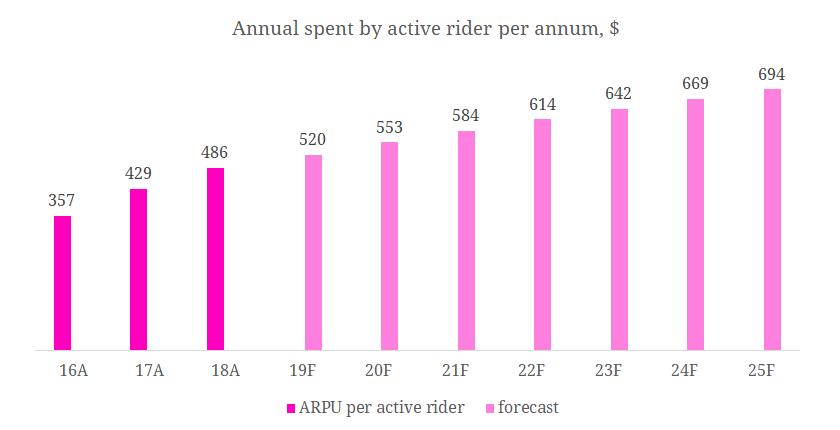
Annual spending by an active rider (rides per active rider * cost per rid) grew from $357 to $486):
- growth in # of rides per annum from 30 in 2016 to 37 in 2018
- average cost per ride from $12 to $13
I expect the cost per ride to grow below inflation (2-3% / year), while # of rides per annum to grow 3-5% per annum due to wider adoption of ride-sharing for the next 5 years which is in line with changing trends we covered above.
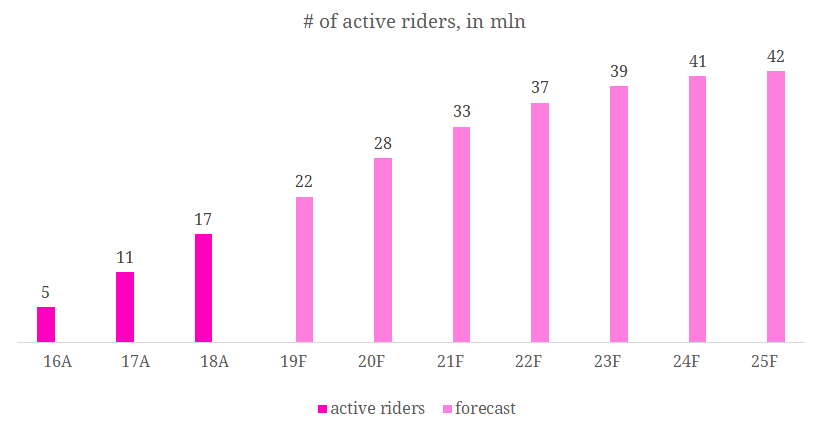
In 2018 Lyft had 16.6mln active riders for the year (growing from 12.6mln as 4Q17 to 18.6 as of 4Q18) and historically, Lyft was able to attract 4-5mln new active riders per annum, I expect the pace of new active riders to maintain for the next couple years and see active rider growth decay above 30 million due to reaching saturation levels.
Historically, we've seen how significant improvement in the commission margin from 13% in 16Q1 to 29% in 2018Q4. Going forward I believe we will see further margin improvement due to fewer incentives to drivers and higher commission on autonomous vehicles which we start to see more from 2020 onwards (Lyft already performed 35k autonomous rides with safety driver in Las Vegas)
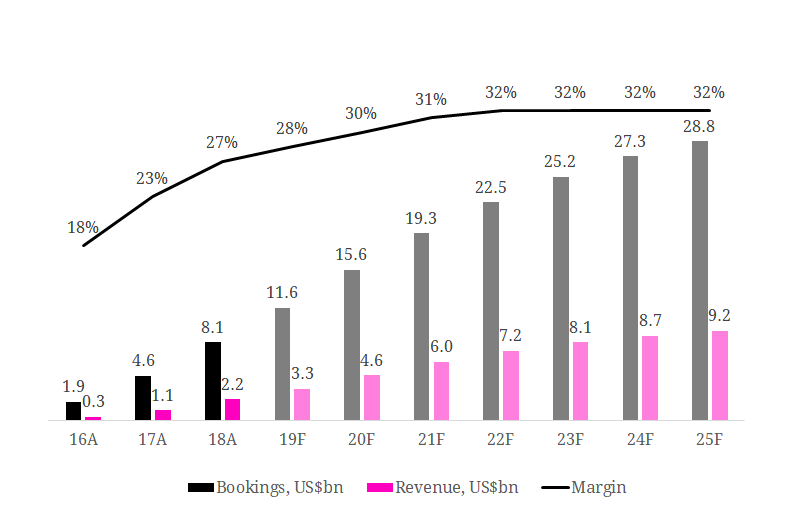
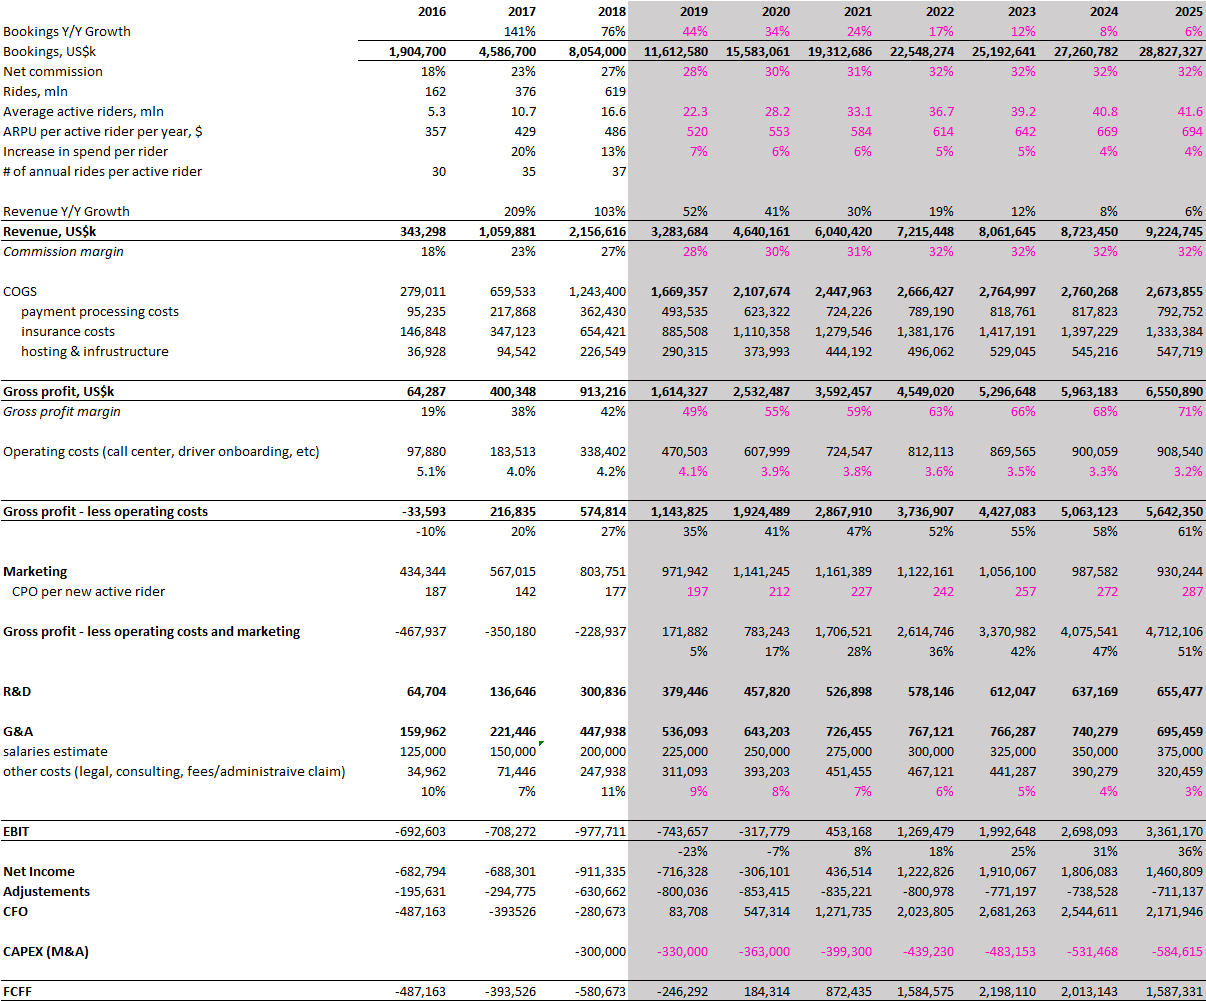
Overall all, modeling Lyft revenue I expect to see the following by 2025:
- Bookings to grow 3.5x from US$8.1bn in 2018 to US$28.8bn in 2025
- Revenue to grow 4.2x from US$2.2bn in 2018 to US$9.2bn in 2025
2. Unit economics
2.1. Defining Lyft business model
For a hundred years car manufacturers have been leveraging their resources in a rather straightforward formula, with zero changes to the business model:
- Significant vehicle R&D
- High spend on advertising to create a brand value
- Build a distribution network of dealerships to sell without talking to end customer
With the introduction of ride-sharing, a new model emerged that we reversed the pyramid with a key focus on being customer-centric while also investing significantly in brand marketing.
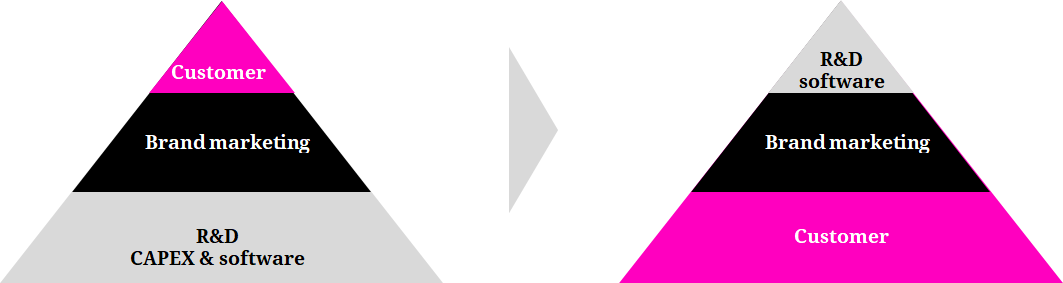
Focusing on attracting demand via distribution partners vs doing so directly completely loses control of customer experience which turns to be horrific and significantly distanced cars manufactures from the ability to see changing needs of customers while pushing them to become a pure commodity and destroying decade-build brands.
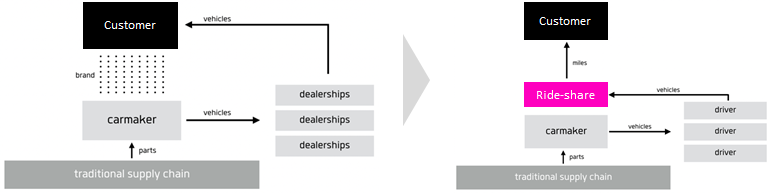
Ride-share companies aggregate all brands under its platform, weakening their value by replacing them as the consumer-facing brand. However, because ride-share drivers purchase or lease vehicles, ride-share companies have limited leverage over carmakers.
Ride-share companies by having a direct relationship with the customer since each customer holds an account with them contain the customer’s credit card information and trip history and can yield better service.
But the most disruptive change that rideshare companies have brought is per mile pricing.
- Design: Pay-per-mile model allows the customer to experiment and experience much richer experience vs sticking to one
- Sharing: Ability to share vehicle utilization among many riders and thus reducing the need to invest capital which significantly depreciates over time
- Electrification: More shared cars are becoming fuel-efficient which also pushes down the cost per ride
- Replacement cycle: Due to significantly higher vehicle utilization service life becomes shorter and the rate at which they will be replaced is higher which allows for a quicker vehicle upgrade similar to iPhones, significantly increasing the rate of technological improvement. Software built on top of this hardware platform will update at an even higher rate.
The popularity rise of the hospitality OTAs beyond the convenience of doing it online was due to structuring the decision-making process of the consumer on three topics: (i) location, (ii) price per night, (iii) quality of a room.
Uber and Lyft have done quite the same for the mobility industry by "democratizing" it even further and left for the customer to choose between (i) type of car and (ii) price per ride
How to autonomous vehicle come into play?
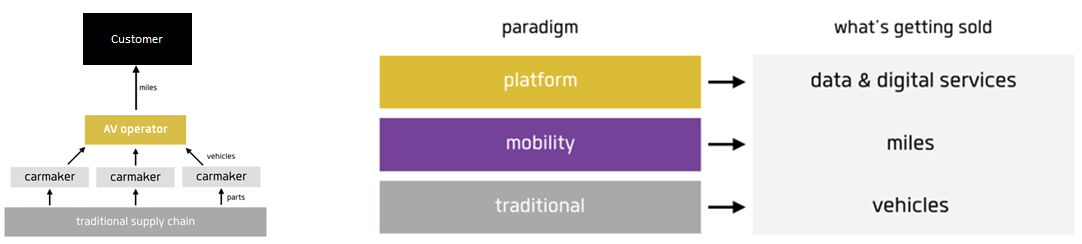
Autonomous vehicles will further shift to the new business model that ride-sharing companies pioneered while significantly deepening the market to which this model will apply. By removing the driver, such automation can potentially lower the price per mile by about 50%. Most likely only a portion of the margin will go directly to the consumer, while the rest will be split among the ecosystem partners, including autonomous vehicle technology.
By creating a self-driving fleet, the autonomous vehicle fleet operator will make collective vehicle purchasing decisions, increasing leverage over carmakers and removing the mediation that ride-sharing companies currently provide.
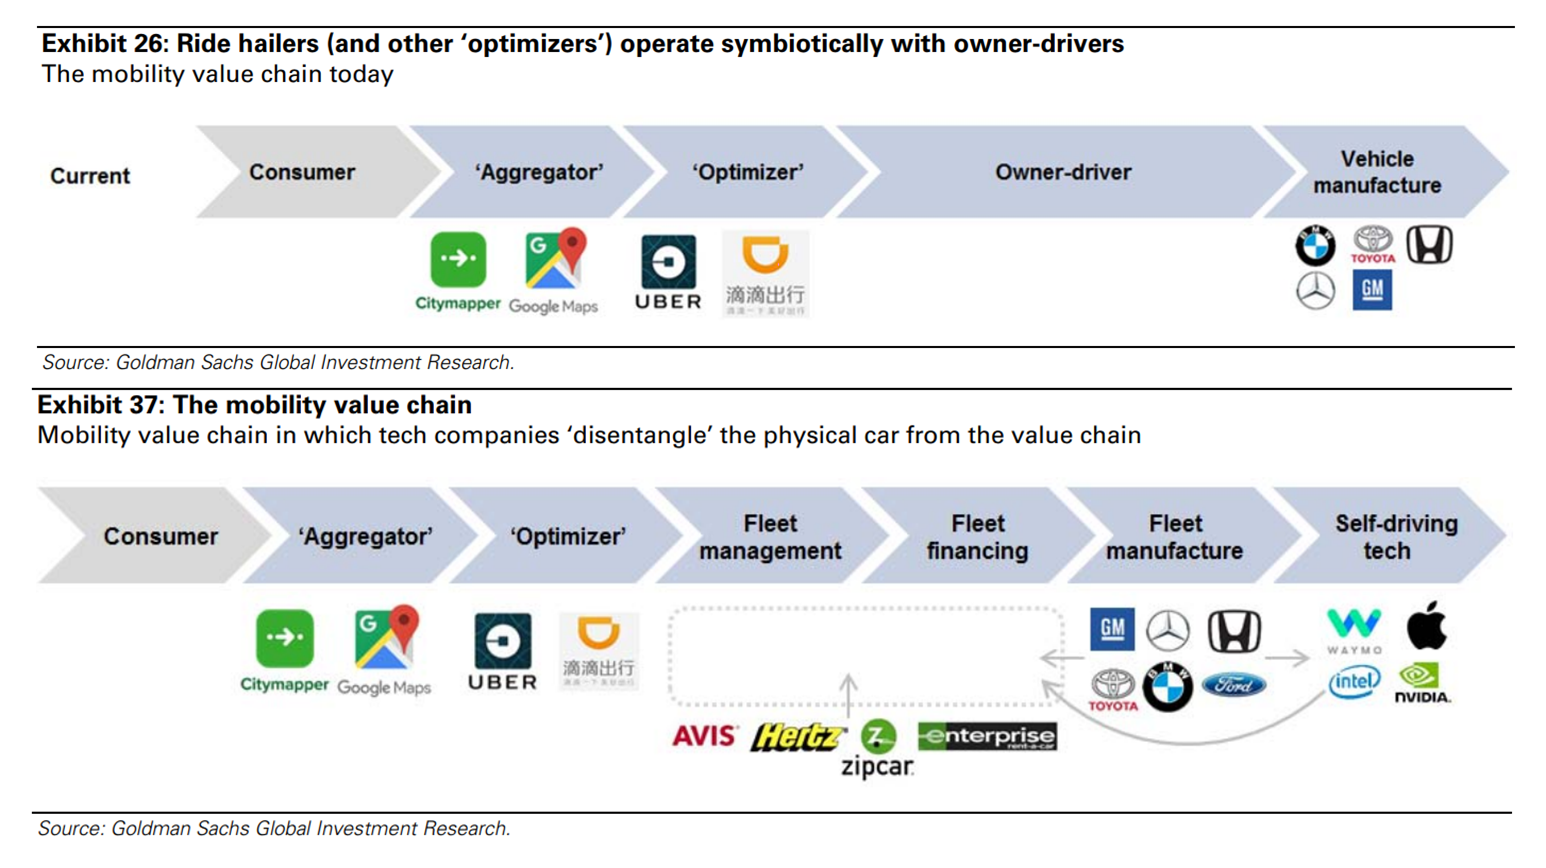
Over time, however, one potential future scenario for ride-sharing companies is what happened to the airline industry. Part of the demand of the transportation network companies (TNC) was taken by the aggregators.
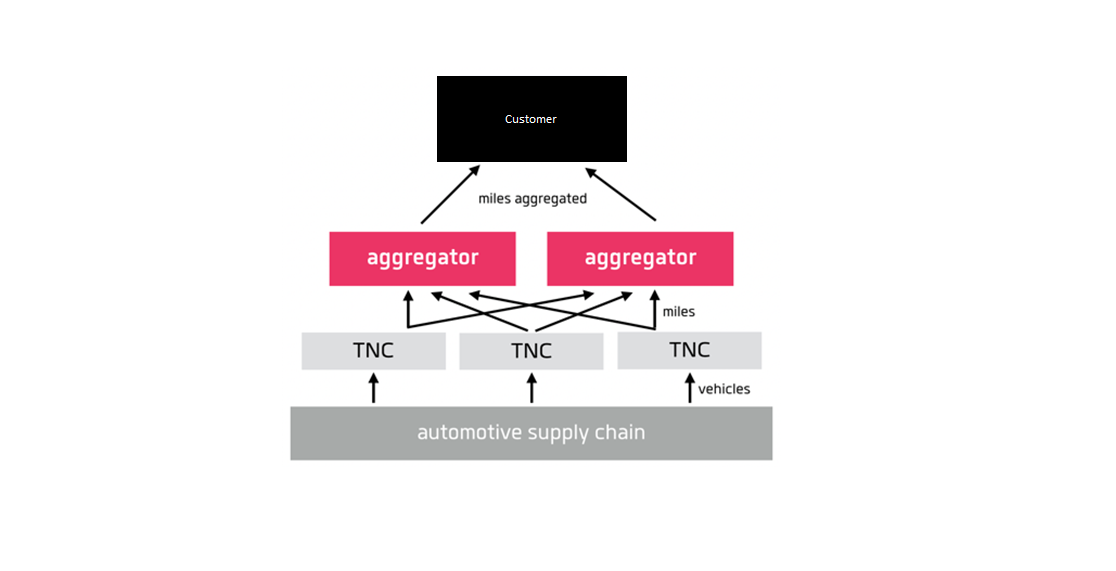
Putting that into perspective into what everybody is doing, the see the following trends happening:
- Vehicle manufacture either push into self-driving
- Car rental companies filling the fleet management gap given low its utilization
- The Optimizers also investing in autonomous but opening its ecosystem to other providers in order to stay in the value chain
There is a reason to be skeptical that the current ride-hail market will fragment given oligopoly of the ride-sharing market and due to its network effects it enjoys on both the demand and supply side. However, autonomous vehicle technology might quickly become commoditized, available to anyone willing to pay to license it. In that case, the barriers by ride-sharing companies will be weakened and the industry could become fragmented with new entrants able to provide a similar service if they invest sufficient capital into marketing.
2.2 Network effects
The presence or absence of network effects is a very critical question for a company, its investors, and anyone who has an interest in a company’s potential to make a durable profit over time, especially if it's currently making a loss.
On one hand, it seems that the business model enjoys strong network effects as a two-sided marketplace, a number of riders influence the value of the platform to drivers and vice versa.
However, looking closely it's an actually an asymptotic marketplace - a rider that will get a driver within 4 minutes will not get 30% less value vs a rider getting a driver within 3 minutes.
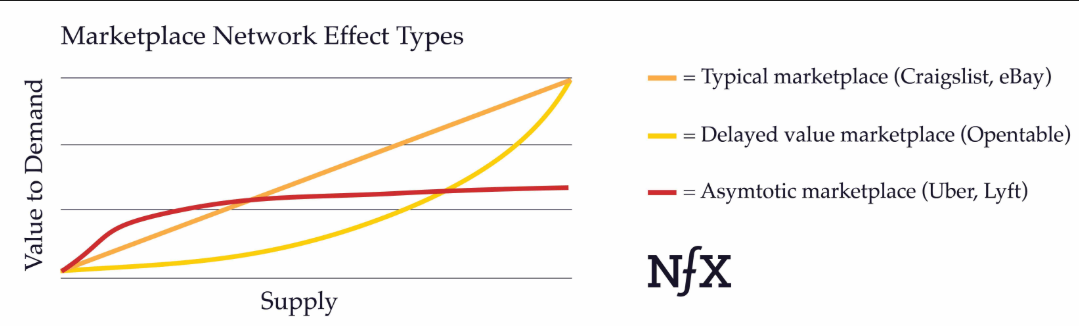
Considering the rideshare market is a local business, in order to compete effectively with other ride-share companies, you only need just enough drivers to provide the same utility function. For instance, for NYC the number is estimated at 8k vehicles for 28 sq. km, or 98k sq. meters/vehicle, which means having an empty vehicle every 300 meters
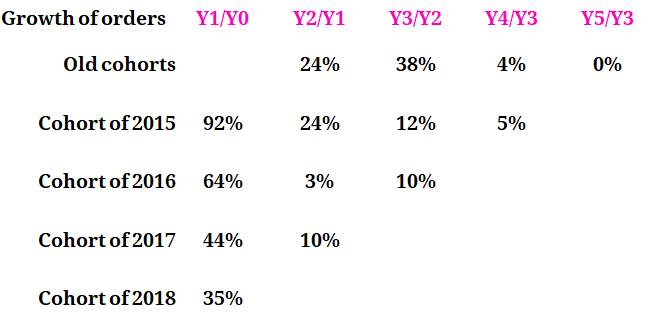
However, despite lack of completion apart from Uber, Lyft enjoyed partial network effects in retention of rides over the years. The chart below shows that orders from riders that joined in 2015 even after a couple of years cohorts are still increasing.
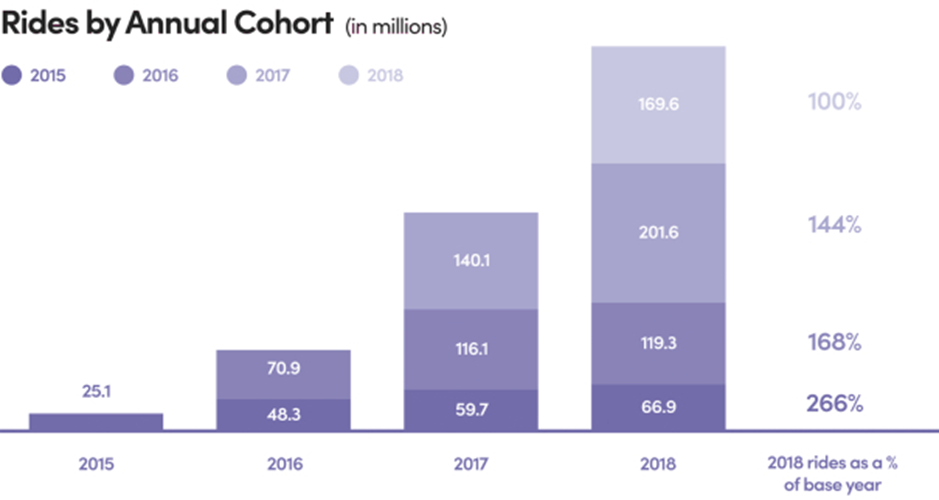
Reforming dataset into a cohort of orders, we consistent growth ever after 2nd and 3rd year.
2.3 Unit economics
Gross margin:
According to Lyft IPO prospectus, the cost of revenue is consists of
- primarily consists of insurance costs that are generally required under TNC and city regulations for ridesharing and bike and scooter rentals,
- payment processing charges, including merchant fees and chargebacks,
- hosting and platform-related technology costs
- amortization of technology-related intangible assets,
- and certain direct costs related to bikes, scooters and the Select Express Drive Partner program, and personnel-related compensation costs.
We will focus mainly on insurance costs, payment processing charges and hosting as key variable expenses.
A) Insurance costs: although Lyft doesn't share how much it spends exactly on insurance, my estimated based on incremental cost in 2017 and 2018 it comes down to 8% of the bookings.
Going forward I expect insurance cost to go down from 8% to 4% as Lyft creates enough insurance reserves to battle potential claims from local regulation due to disruptive its business model on the local economy.
B) Payment processing costs: each time a credit card is swiped, a transaction is incurred. On a $100 transaction effective commission would be close to 2.5%. However, average lyft ride costs only $13, and cost per transaction on smaller order significantly increases due to "swipe fees". Typically credit card transaction consists of:
- Visa Credit Card Interchange Rate: 1.5% + 10¢ per transaction (the majority of 1.5% interchange rate goes to the bank which issued the card with 0.2-0.3% going to visa)
- Merchant provider: usually charge 0.5-1% + 15¢ per transaction (fixed costs stay the same, variable part depends on the merchant provider)
All in all, on a $13 transaction you get = 25¢ per transaction + 2-2.5% which brings the average cost of transaction closer to 4-4.5%.
I believe by optimizing ride and tip as one transaction and negotiating better contracts with growing booking volume the company can overtime reduce transaction cost down to 3% of the bookings.
C) IT & infrastructure costs: currently they are at 2-3% of bookings.
My estimate that overtime company infrastructure costs will go down back to 2% of bookings.
Overall, with increasing I expect to see cost optimization a total of 6% of bookings, however, coupled with an increasing commission margin from 27% to 32%, gross profit can increase from 42% in 2018 to over 50% by 2022 and over 60% by 2025.
Operations and Support
Operations and support expenses primarily consist of personnel-related compensation costs of local operations teams and teams who provide phone, email and chat support to users and other fees to third parties providing operations support and driver background checks and onboarding costs.
Currently is stable at 4% of gross bookings, however with more customer support automation and gradual introduction of the autonomous fleets I expect to see the reduction of costs by 30% down to 3% of gross bookings.
Measuring blended CAC
Seeing strong cohorts of rider we can assume that majority of active riders stay on the platform (let's assume 90% of active riders) with growth in a number of rides coming from a higher number of rides per each active rider.
Dividing the number of riders in each year by an average number of rides an active rider completes a year we get that in 2017 and 2018 a total of 4mln and 4.5m new active riders were brought to the platform.
Assuming due to such a sticky product all of the company marketing goes into bringing new active riders, the total cost per an active rider and necessary drivers to complete those rides stand at ca. $150-200.
Calculating LTV
Let's limit the period to 5-years considering we already see stable cohorts from 2015. How to calculate LTV can be read here, we will not discuss it here in detail.
We see that an active rider during 2018 brought ca. $500 revenue. Currently, gross margin currently stands at 42%, despite that we expect it to increase to over 60% in the upcoming years. However, we also see that operating costs (call center, driver onboarding etc) also seem to be a variable cost, which reduces "adjusted gross margin" down to 17%.
Today, an active rider brings today an "adjusted gross profit" of $500*17% = $85 per year.
With CAC standing at $170 we total active rider payback period (and driver supporting such active rider) is 2 years and based on 5Y horizon a LTV/ CAC over 2.5x.
Going forward
I expect that company can continue onboard more active rider on the platform until it reaches a saturation point of 40mln active riders, which represent ca. 27% of the USA urban population between 15 and 65.
Considering the steady pace of new clients and improving gross margin and operating costs, overtime LTV / CAC economics should improve. I model an increase in marketing cost by 20% per annum per active rider each year.
R&D
Currently, R&D costs are the driver for innovation are represent 14% of total revenue, I expect to see them growing but at 50% of revenue growth which will bring them down to 7% by 2025, similar to other technology companies at scale.
G&A
Although there is no breakdown between team costs and legal/consulting bills, my expectation that team costs will grow by US$25m each year from a current estimates of US$200m to US$375m by 2025, while other G&A costs to growth from US$250 to US$350 declining from 11% of revenue down to 3%.
3. Financials
Mapping all projections together I estimate the Lyft will get to break-even by 2021 and can reach EBIT margin above 30% by 2025 and cash flow positive in 2020.
One interesting insight while looking at Lyft cash flow in 2016-2018 is that despite the company was losing US$700-950mln each year, cash flow wise it was draining much less - only US$300-500mln. This was primarily due that insurance costs were used to create insurance reserve trust which stands at US$789m as of 4Q2018.
Going forward, I expect insurance trust reserve to reach ca. US$6bn.
Below is my forward-looking annual P&L statement for Lyft.
4. Lyft IPO valuation
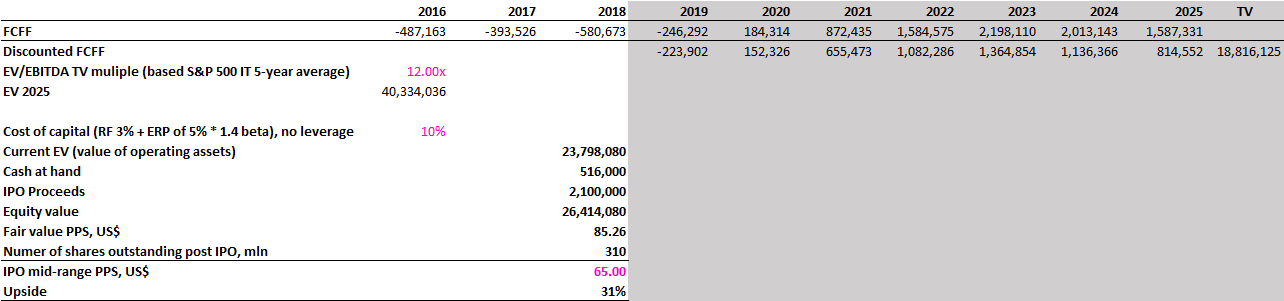
Lyft will have 310mln share post IPO:
- Currently, Lyft has a total of 279mln shares on a fully diluted basis
- Lyft IPO is offering an additional 30.8mln shares
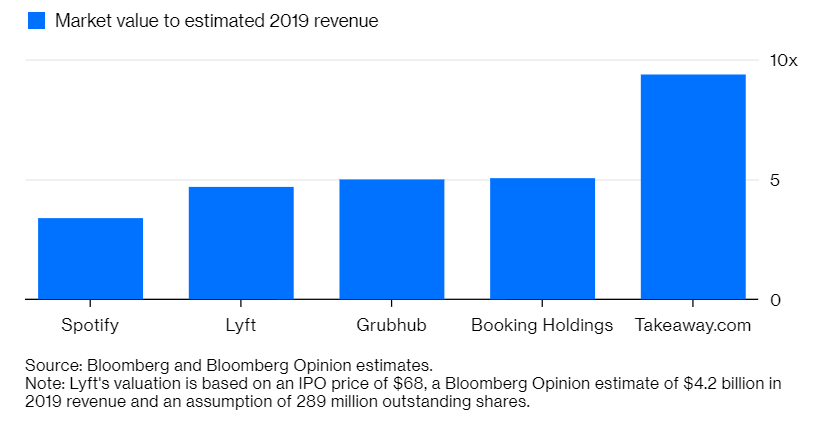
Comparing Lyft to other marketplace-type companies that are priced at the same 5x 2019 revenue level:
- GrubHub is growing at 47% y/y and has a 23% EBITDA margin
- Booking Holdings is growing 15% y/y with 40% EBITDA margin
My estimate for Lyft 2019 revenue is more conservative vs bloomberg, mainly due to slower rising of commission margin and slower growth of gross bookings. At mid-range PPS of $65, company trades at 6.1x EV/ 2019 Revenue
Running sensitivity analysis on key assumptions we get the following tables:
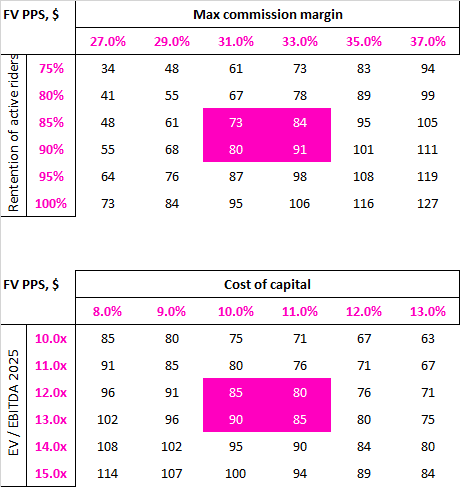
Resume:
All in all, my calculations suggest current Lyft intrinsic value is around US$26bn or PPS (price per share) of $85. Based on Lyft mid-range PPS of 65$ (announced IPO range was $62-68), and provides an upside of 31%.
Lyft IPO valuation excel can be downloaded here.
If you have any questions or comments, please ping me at afedorov@buranvc.com
Some links used in the research: